

Profit and loss explained analysis and reporting has become a required tool for the middle and front office. Brian Shydlo of Essentia Advisory Partners looks at what needs to be considered when designing and developing P&L explained reporting systems, and considers some exciting potential uses for it.
Profit and loss explained analysis is a powerful tool for the risk manager and trader if implemented and used optimally. However, its true depth and complexity are often not fully appreciated. While P&L explained reports have been around for over ten years, it has only been since 2003 and the emergence of sophisticated investment banks and hedge funds with proprietary energy trading desks that this tool has grown in popularity and viewed as a requirement.
This article sets out to raise awareness of the potential and complexity of this tool and also provides guidelines for designing and developing P&L explained reporting solutions. The final section assesses the current environment for information technology solutions, dispels some common myths, and looks to the future.
For anyone considering a P&L explained project it is important to have clarity and understanding upfront as it can be costly to make design changes later. Many companies therefore involve experts in the initial stages to help accelerate the company toward its goals.
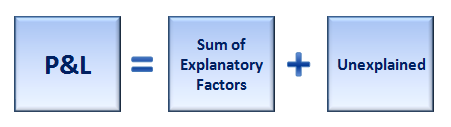
Profit’s Root Cause
A P&L explained analysis attributes the daily change in the value – ie the mark-to-market (MTM) – of a portfolio of deals to its root causes. Risk managers use this knowledge of the source of trading profits to act more effectively. For example, they will investigate if they discover that options desk’s profits are primarily due to commodity prices changes instead of volatility changes. Traders use this report as a diagnostic tool to help them reconcile at end-of-day if their hand-calculated P&L estimate doesn’t match the value produced by their trading system.
Items that influence P&L include changes to deal attributes (volume and trade price), market data (commodity prices) and, for options, number of days to expiration. The sum of these explanatory factors as calculated for a given analysis would ideally equal P&L, which is taken as a given. Often they are close but not equal so there is a residual which on reports is labeled “unexplained” or “variance”. See Figure 1.
Figure 1) General Formula for P&L Explained
A typical report layout has columns for total P&L, unexplained P&L, new deal P&L, and any other explanatory factors which have had an impact. For example, profit and loss due to commodity price changes would appear in a column headed ‘Impact of Prices’. There is typically one summary report with rows per portfolio, trade type or commodity and a detailed per trade report.
Two different methodologies are used in P&L explained reporting; the sensitivities method and the revaluation method. The first uses sensitivities known as the Greeks and is the most common because most firms already compute these values thus making this method relatively easier. For example, ‘Impact of Delta’ uses the Greek that shows the first order sensitivity to market price changes to explain P&L. The formula is: (Today’s Price minus Yesterday’s Price) * Delta per tick / tick size where Delta is profit from a one tick move and tick size is usually $0.01.
The second derives explanatory factors by recalculating MTM repeatedly using the actual inputs from the current and prior day, swapping them out one at a time while keeping the other inputs unchanged. This can be relatively more accurate than a basic sensitivities approach. For example, the delta sensitivities of spread options and swaptions are not additive as they are for vanilla options, a phenomenon known as cross gamma effect. The revaluation method effortlessly handles this effect while it is often ignored when using the sensitivities approach because it requires an additional complicated formula. Each approach has several other pros and cons.
Design Requirements
All organizations have three core requirements for a basic end-of-day P&L explained report. See Table 1.
Table 1) Core Requirements
| 1 | The numbers are correct |
| 2 | The numbers are in the correct buckets/columns |
| 3 | The presentation of the report is suitable |
The first core requirement is that the numbers are correct, meaning the explanatory factors fully explain the P&L and there is no residual P&L due to unknown causes. Few P&L explained reports actually meet this most critical requirement. Different deal types have distinct features and operational characteristics and not all reports contain the logic needed to describe these features and avoid unexplained P&L.
The second requirement is that each component of P&L be attributed to its correct cause, meaning every ‘Impact of’ column on the report has the appropriate value. While it can be difficult to code a report to get the numbers right for all circumstances, for example, P&L due to deal amendments, the main challenge for software vendors to create an off-the-shelf solution arises from the fact that each trading organization has unique preferences. Some firms may display P&L due to new trades as a single value and others will split new trade P&L and related broker fees into separate columns. Another allocation decision occurs when a firm uses a volatility formula that is dependent on market prices. Market price changes directly impact an option’s MTM and there is a secondary effect on the MTM due to the revised volatility. Some firms view the second effect as ‘Impact of Volatilities’ and others as ‘Impact of Prices’.
The final requirement is that the presentation of the report is suitable, meaning both the formatting of the report and the technology. Report output solutions can range from a simple text file to a pretty report created using a report writer tool and can employ an Excel pivot table front end or a web-based datamart.
Firms may also desire additional features such as:
- Charts and graphs
- Drill-down capability
- Ability to run intra-day and not just at end-of-day
- Interactive grouping, summing, and filtering
- Alternate reporting views, one focusing on attribution by deal and another by net position.
Suggestions And Considerations
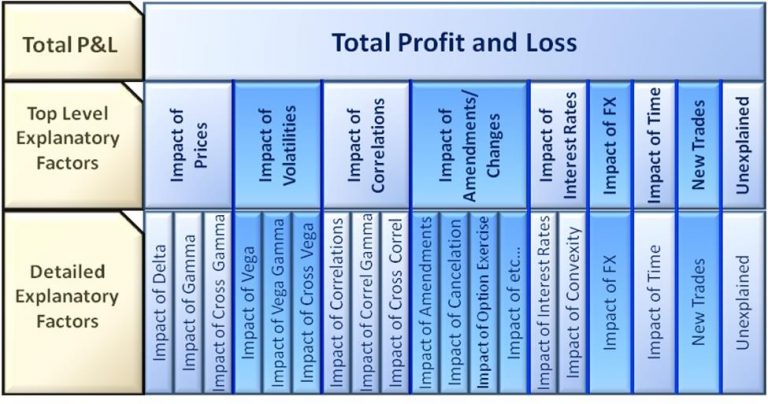
One suggestion to increase usability is by summarizing explanatory factors into a two-level hierarchy. Each top-level group would be the sum of one or more bottom-level contributors to P&L. A report would display the summary columns and allow users to expand/collapse each to see the detail columns. A hierarchy solution might take several dozen detail-level columns and summarize them into typically nine columns, although firms may prefer alternate groupings. See Figure 2.
Figure 2) Hierarchy of P&L Explanatory Factors (Assumes Sensitivities Method)
 A second suggestion is to include both the actual unexplained and the absolute value of the unexplained. When summing the unexplained at the portfolio level positives and negatives of the original per-deal unexplained tend to cancel out leaving a misleadingly low net unexplained. Looking at the sum of the absolute values solves this issue.
One design consideration is whether to explain P&L due to market data inputs or outputs. For example, natural gas forward prices defined as a spread against Nymex natural gas have two inputs (Nymex price and a basis spread) and one output (all-in price, i.e. the sum of the inputs). Or suppose a volatility formula with four inputs (at-the-money volatility, a factor that determines the flatness of the curve, the strike price of the option, and the forward price) that calculates one output volatility. In either case you could attribute P&L to either the multiple inputs or to changes in the single output value. Using market data inputs to explain P&L can be useful as this method better matches the way traders view the markets. Using market data outputs can be simpler to implement as in the case where the inputs aren’t available in the trading system because a firm imports only the outputs from another system where they are computed based on the inputs which exist only in that second system.
Another consideration is how to design drill-down by time, e.g., to see month-by-month explained for multi-month deals. Producing consistent numbers for deal types that have different lowest levels of granularity (monthly/daily/hourly) is problematic. Some firms create a single report at the monthly level that works for all deals even though it requires massaging the numbers to fit this format and also create additional reports for daily or for hourly exposures where these reports run for only the relevant subset of deals.
Current environment, myths, and the future
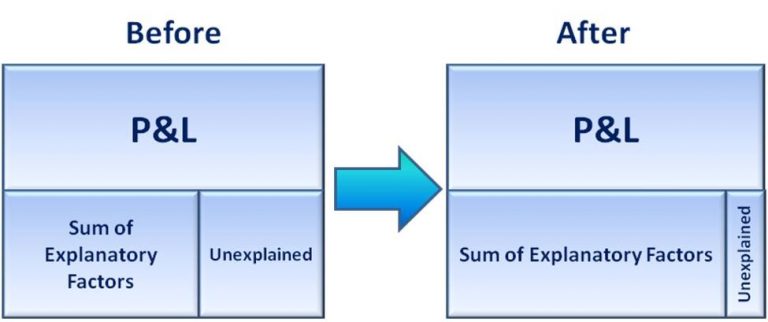
Providers of energy trading and risk management software currently offer out-of-the-box P&L explained reports. However, no off-the-shelf P&L explained solution meets 100% of the three primary requirements described above all of the time. A typical scenario occurs when a firm starts by using a vendor-provided report and then enhances it either to meet their custom allocation requirements or to reduce unexplained. For example, some organizations set formal unexplained thresholds which if exceeded compels them to seek a resolution. In some cases, usually after one too many enhancement iterations with a vendor-supplied report, a firm will decide to build their own report. This allows them to fully meet their short terms needs and gain control over how the report will work in the future. See Figure 3.
Figure 3) Goal of a Typical P&L Explained Report Enhancement Project
 P&L explained reporting is the subject of two common myths. The most common myth is that the P&L number must be incorrect if, after calculating all of the known causes, there is residual P&L still unexplained. In fact, the P&L number is always considered correct in a P&L explained report, although it certainly makes risk managers uncomfortable if the value in the ‘unexplained’ column on the report is not zero. Therefore, when you do find the cause of the unexplained P&L, which is usually done manually after the fact, the total P&L number never changes due to any reallocation, even a reallocation from ‘unexplained’ to one of the explanatory columns.
The second myth is that P&L explained reporting is easy, a myth that is refuted by the many considerations described in this article. Furthermore, as demanding as it is for a firm to build a solution to meet its own limited requirements it is even more difficult for a vendor to produce a solution to suit the needs of multiple client firms.
Looking to the future, expect software companies to continue to incorporate client feedback and improve their P&L explained reports which will be sufficient for some firms. It is likely the most sophisticated firms will continue the trend of designing and building custom P&L explained solutions to meet their complete requirements. It is also likely that, as P&L explained reporting is mastered, other kinds of ‘explained’ reports will become popular, such as a VaR (Value-at-Risk) explained report that would show why VaR changed from one day to another.
About Essentia
Essentia is a Houston-based consulting firm focused on partnering with energy and commodity trading companies to help them maximize their return on investment from trading systems & technologies. Since our founding in 2016, our team has grown to 85 full-time consultants who have, as Essentia, implemented or upgraded Energy Trading & Risk Management (ETRM) solutions at more than two dozen companies across North America. With an experience-laden team and hyper-focus on the client, we are proud of our record of taking clients From Start to Success and our impressive client satisfaction, as demonstrated by subsequent engagements with many of our clients.
Brian Shydlo is a partner at Essentia Advisory Partners. He is a thought leader in the field of energy trading and risk management software with 20 years of experience including participation in multiple ETRM implementation and upgrade projects.
Email: brian@essentiaap.com

